
About Me
Hey, I’m Abdulrasaq Umar Yakubu but you can call me theabdool.
I’m a Data Analyst and Business Intelligence Developer who’s all about turning numbers into narratives that make sense.
I don’t just clean data and build dashboards, I dig deep to find what really matters. Whether it’s spotting trends, uncovering patterns, or helping teams make smarter decisions, I’m here to make data less intimidating and more impactful.
Tools like Power BI, Tableau, Excel, PostgreSQL, and Python? That’s my daily toolkit.
But what sets me apart is how I use them to tell clear stories, spark conversations, and drive results that matter to real people.
Let’s just say: I don’t build charts for decoration; I build them to make a difference.
Skills

Excel | Power BI | PostgreSQL | Tableau | PowerApps | Python | Power Automate
Data Visualization
Data Analytics
Data Manipulation
Data Modeling and DAX
Team Leadership and Coordination
Analytical Report Generation
My Projects
Power BI | Power Query | DAX | PowerPoint
Medical Service Provider Analysis: Optimizing Healthcare Through Data-Driven Insights
This Power BI dashboard offers a comprehensive analysis of medical service provider operations, focusing on fiscal performance, trend evaluation, and provider assessments. Through interactive visualizations, it uncovers key insights into billing amounts, departmental efficiency, and physician performance, empowering healthcare administrators to optimize services and improve patient outcomes.

Microsoft Excel | Pivot Table
KraftHeinz Biscuit Sales Analysis Dashboard
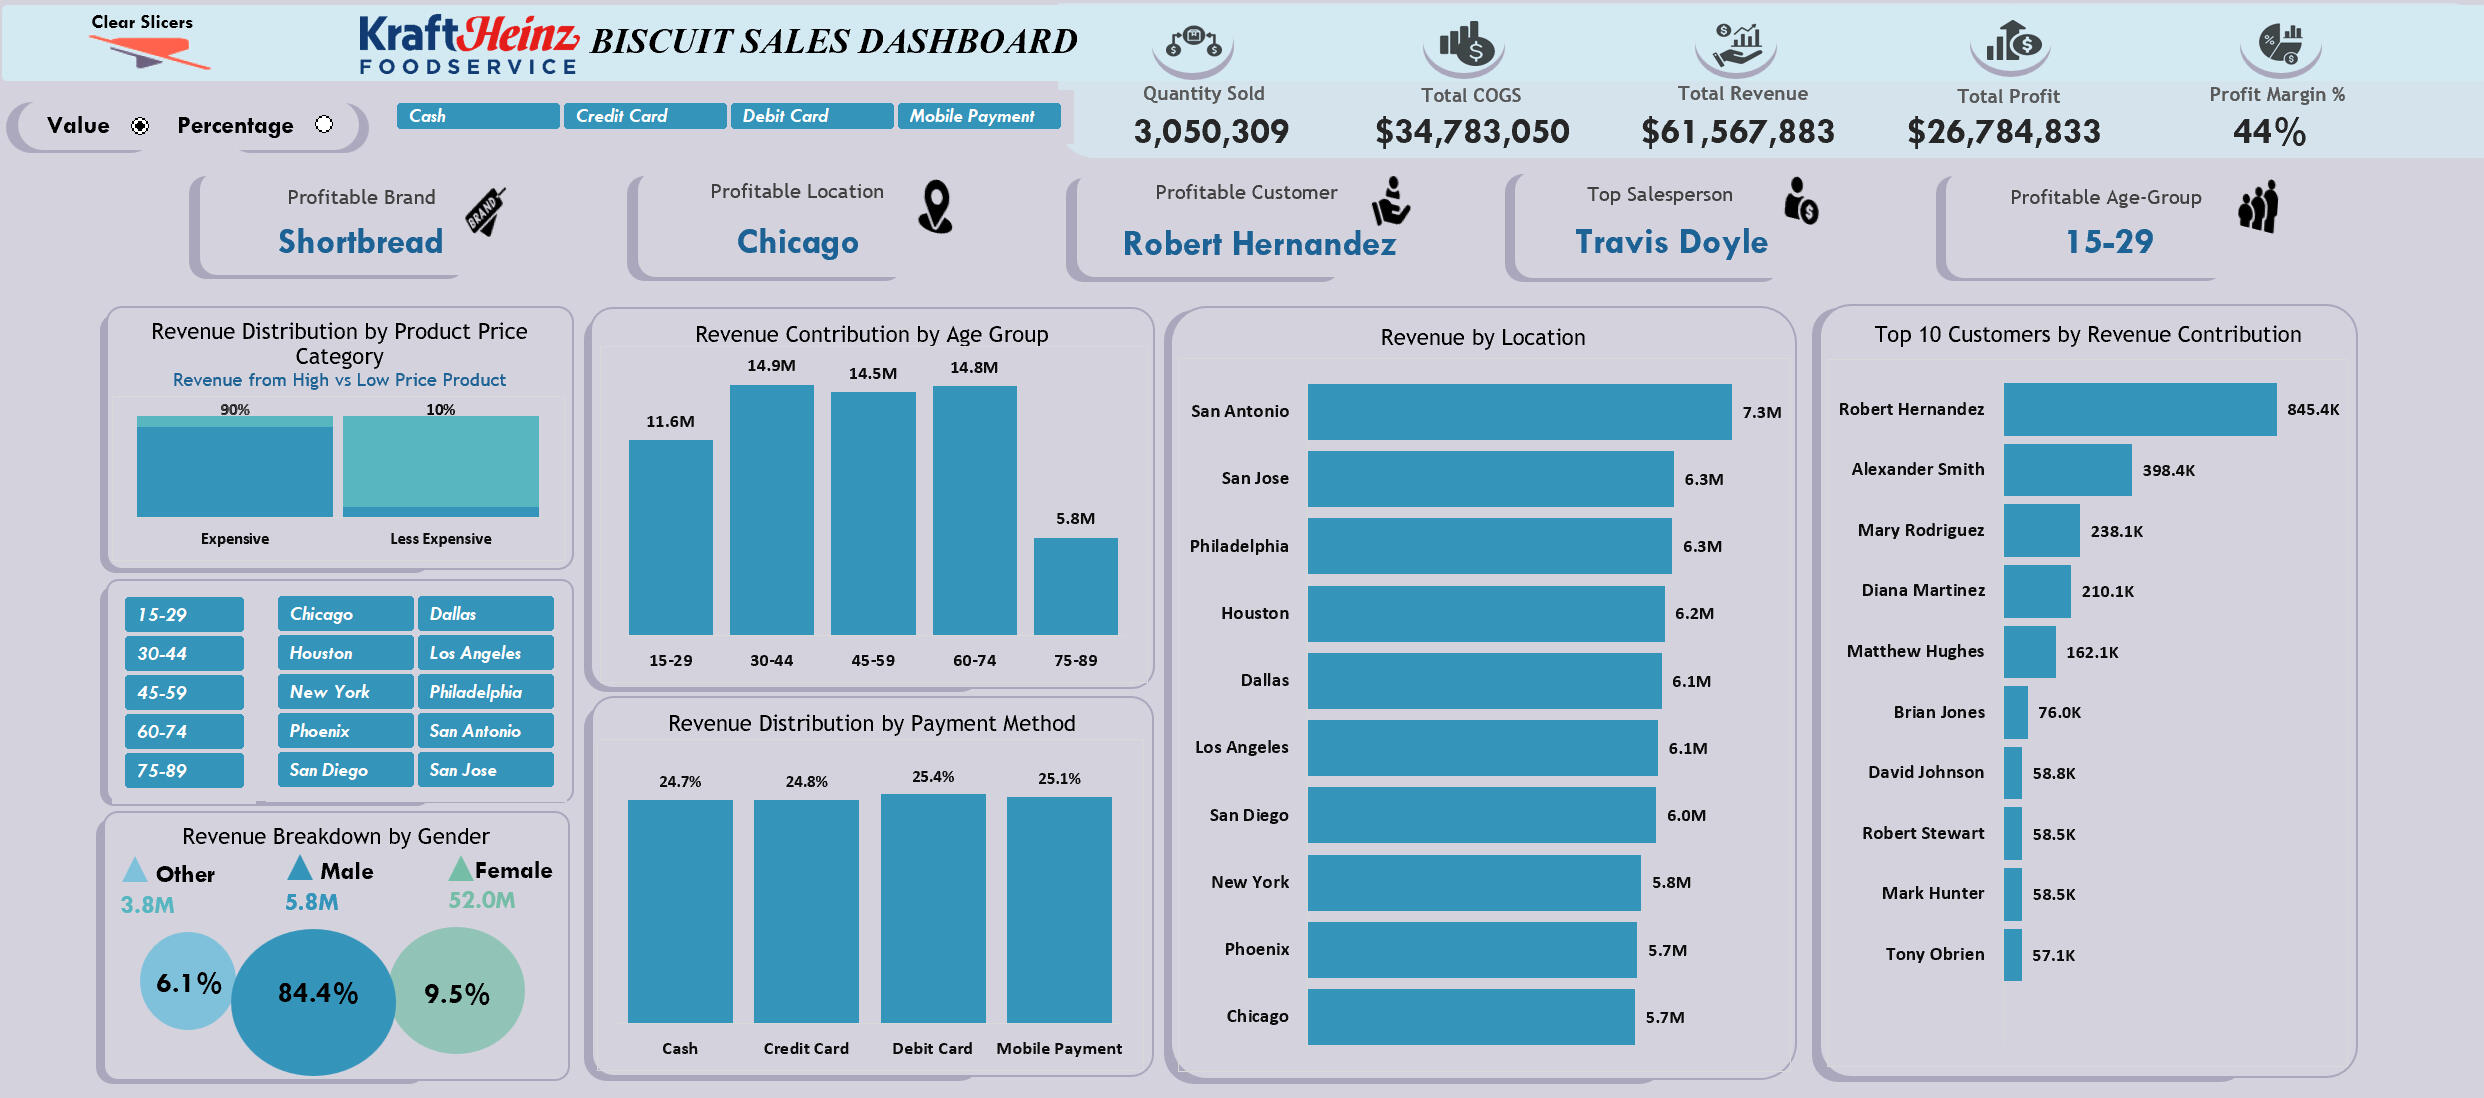
In this project, I developed an interactive sales dashboard for KraftHeinz Foodservice, analyzing biscuit sales performance across multiple metrics. The dashboard provides insights into product sales, customer demographics, and revenue distribution using clear, visual analytics tools.This dashboard was designed to help KraftHeinz make data-driven decisions to optimize their sales strategy, product pricing, and customer engagement efforts.
Data Modeling | Data Cleaning | Power Query | Power BI
Ozone Concept Ltd Inventory Optimization Analysis
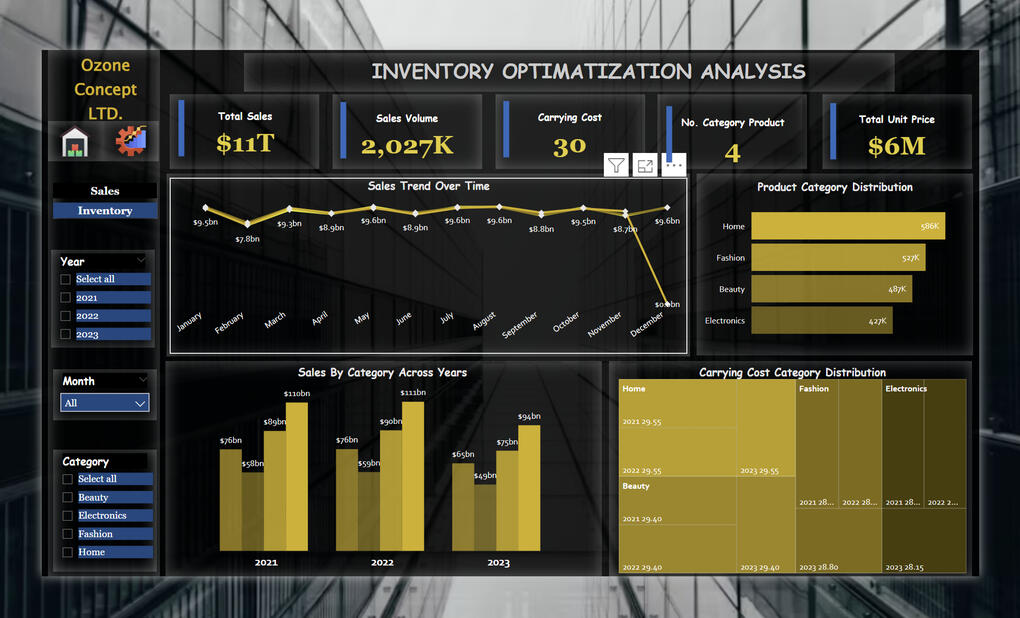
This comprehensive dashboard provides a 3 years (2021-2023) detailed analysis of inventory management practices at Ozone Concept LTD, offering insights into stockout incidents, inventory turnover, average inventory levels, product category performance, and overall business efficiency.
Data Collection | Data Cleaning | Power BI
Sales Analysis and Self-Service BI Implementation
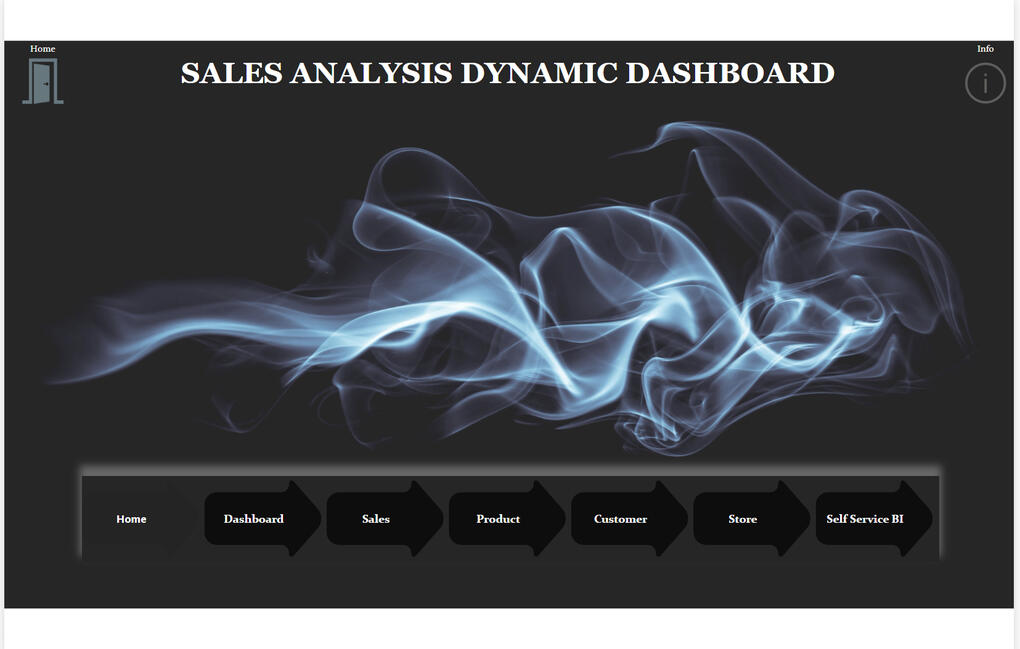
The objective of this project is to conduct a comprehensive sales analysis covering products, stores, customers, and overall sales performance. Additionally, the project aims to implement a Self-Service Business Intelligence (BI) system to empower stakeholders with the ability to generate insights independently.
Tableau
Electric Vehicle Market Analysis
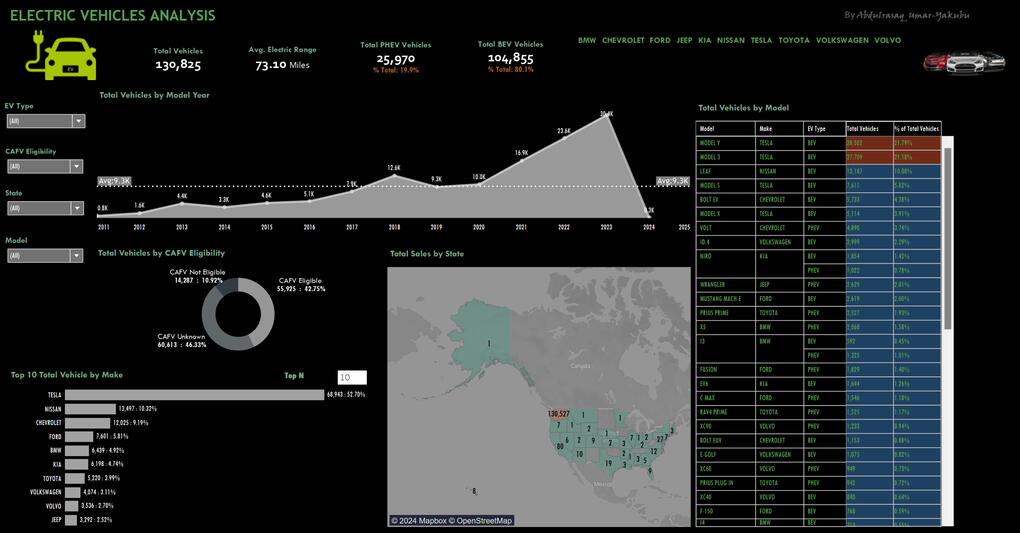
This projects offers a deep dive into the electric vehicle (EV) landscape, providing valuable insights into market trends, consumer preferences, and technological advancements. By analyzing key metrics such as total EV sales, average electric range, vehicle type distribution, charging infrastructure development, and regional adoption rates, this dashboard offers a holistic understanding of the EV industry's current state and future prospects.
Excel | Macros | Data Visualization Techniques
Coca-Cola Sales Analysis Dashboard
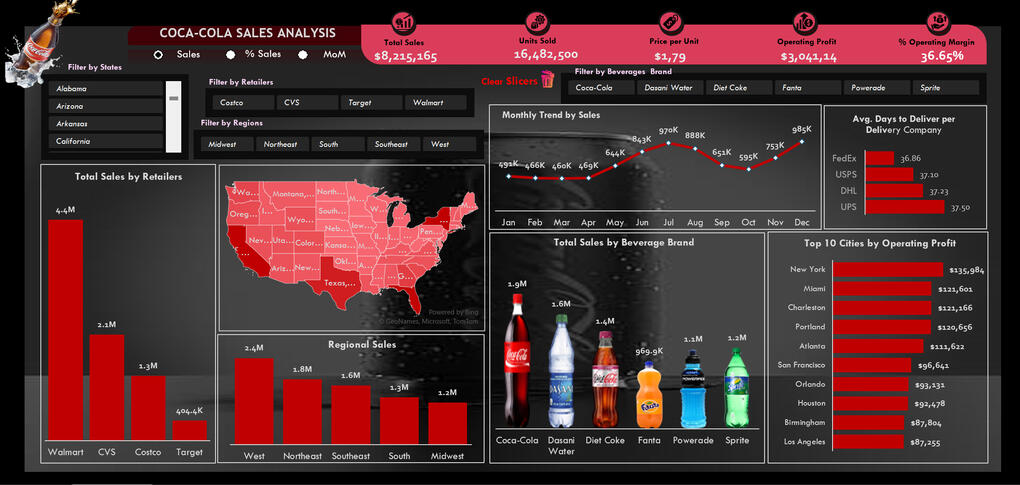
In this project, I developed an automated Coca-Cola Sales Analysis Dashboard using Excel with Macros to provide dynamic, real-time insights into the company’s sales performance. The dashboard showcases a variety of key metrics, including total sales, units sold, regional and retailer performance, monthly sales trends, product-line breakdown, and operating efficiency. Leveraging Excel’s powerful macros, I automated the data processing, filtering, and visualization, significantly improving efficiency and accuracy.Key insights such as Walmart’s dominance in retail sales, peak sales in July, and FedEx’s efficient delivery times were identified, offering Coca-Cola actionable data to optimize their supply chain, marketing strategies, and regional operations. The use of Excel Macros allowed for a seamless workflow, ensuring scalability as new data becomes available.This project demonstrates my ability to transform complex data into a clear, interactive dashboard that supports business decision-making and operational efficiency.
Power BI | Power Query | DAX | PowerPoint
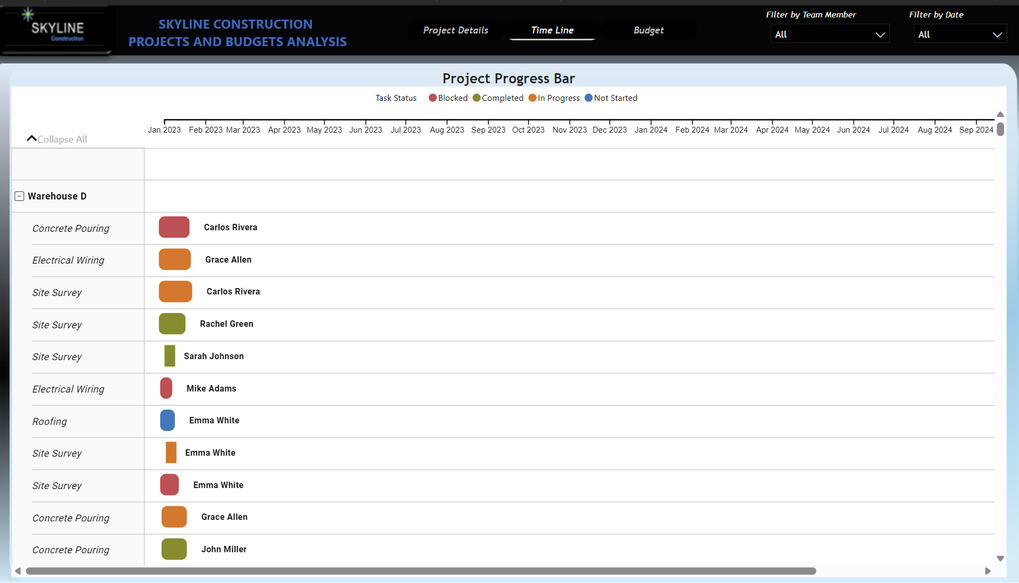
Skyline Construction Budget Analysis Using Gantt Chart
The analysis simplifies complex project data into actionable insights, helping teams make informed decisions, avoid cost overruns, and optimize budgets effectively.It showcases a comprehensive overview of total budgets, expenditures, and progress tracking for various projects.The dashboard is interactive and aimed at empowering stakeholders to monitor budget utilization, identify discrepancies, and evaluate project performance effectively.
Excel | Data Visualization, PivotTables
WALLET WATCH:
INCOME AND SPENDING TRACKER
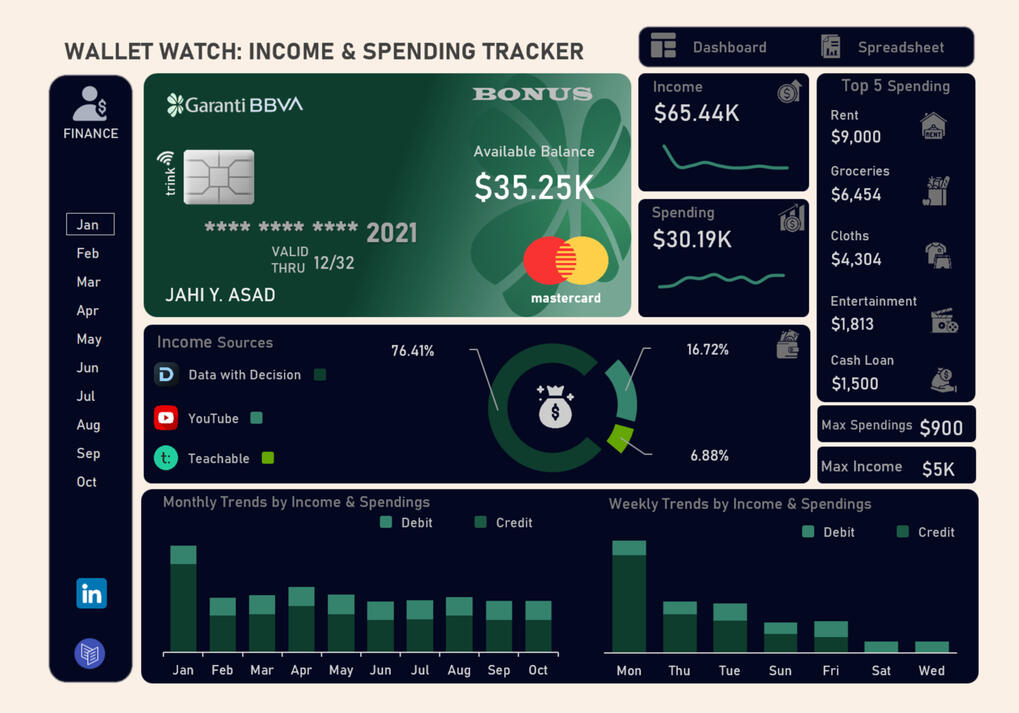
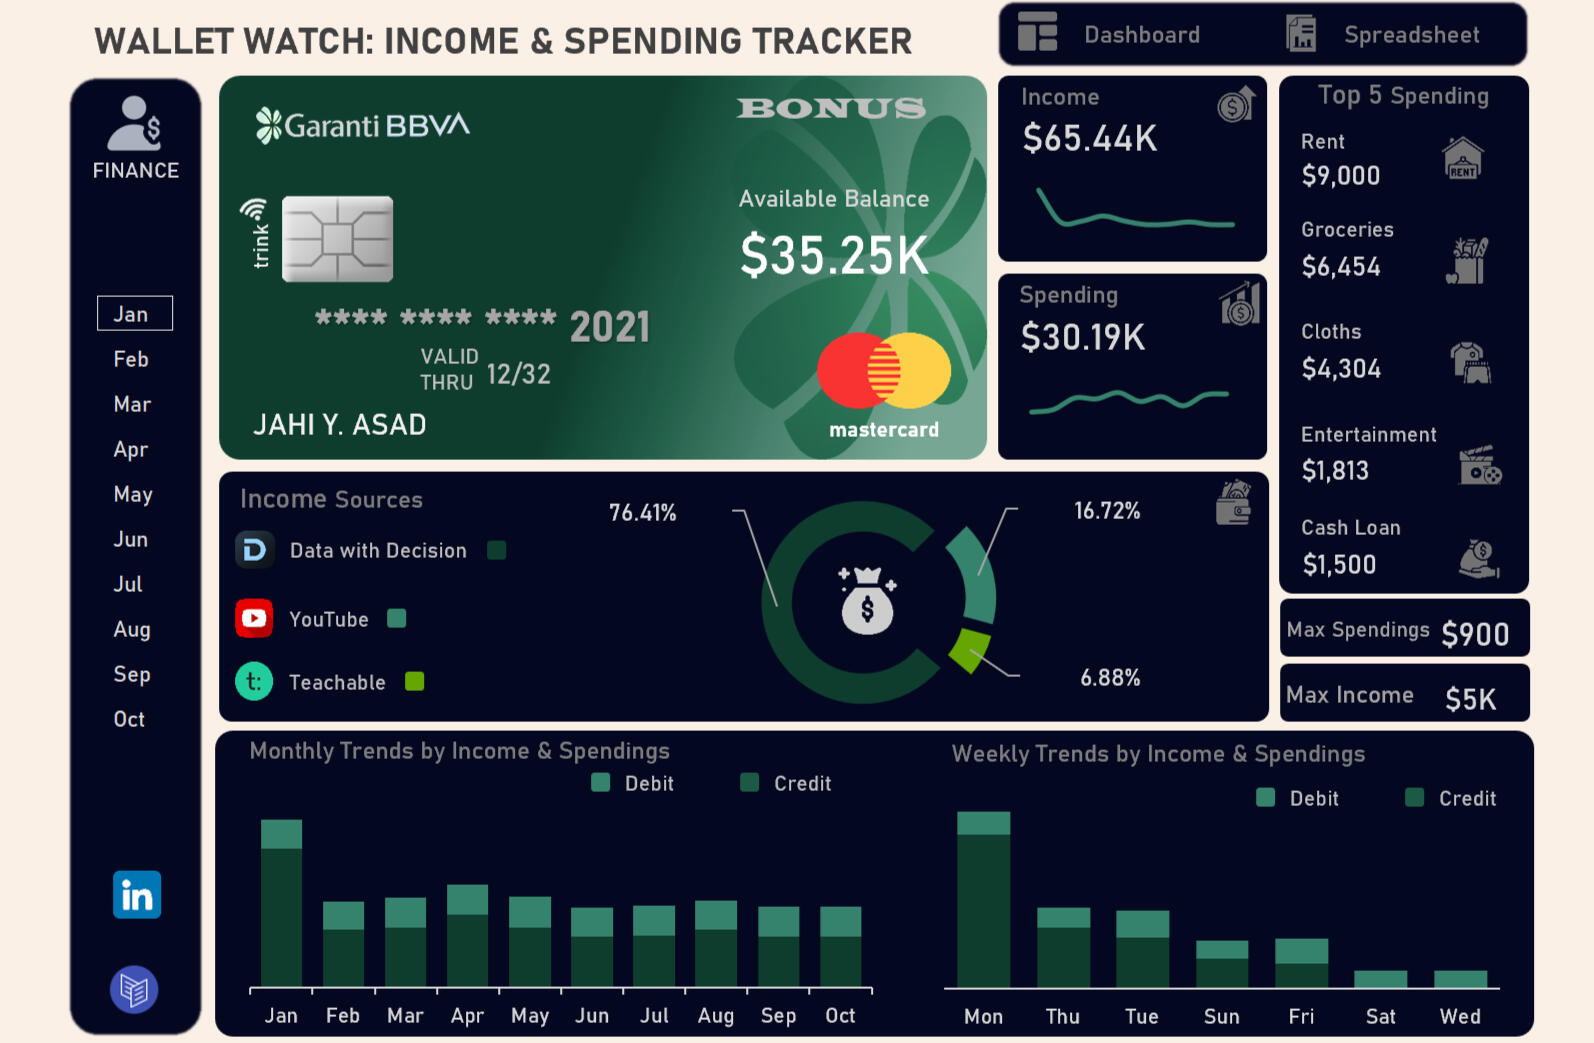
This Excel dashboard simplifies personal finance tracking by offering clear insights into income, spending, and budget behavior.It provides a comprehensive view of total earnings, top spending categories, and trends across months and weekdays.The interactive layout empowers users to monitor financial habits, identify high-cost areas, and make informed budgeting decisions efficiently.
Professional Certifications
My Expanding List of Exam-Based Certifications

Business Intelligence Certificate | Issued 2024

Data Modeling in Power BI | Issued 2024
KraftHeinz| Biscuit Sales Analysis Dashboard
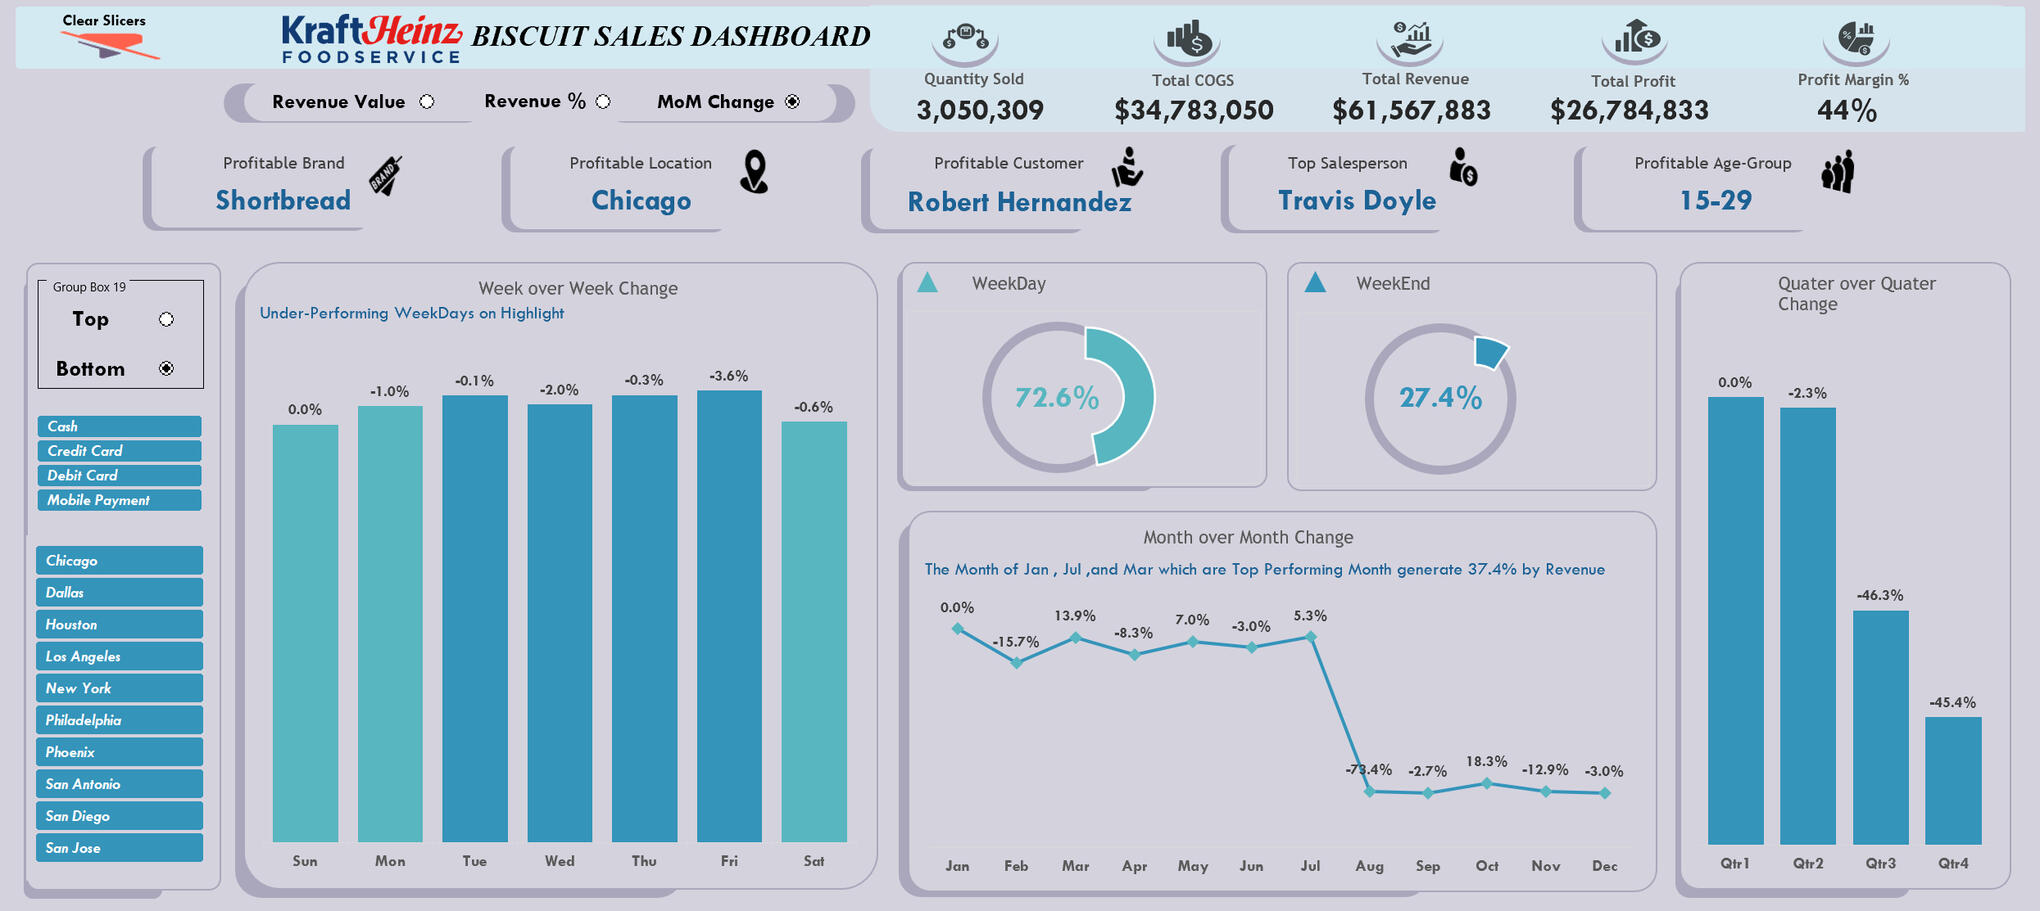
This project looks at the revenue, customers, locations, and overall profitability.
Here are the key things i want to show in the first and second dashboards:
Revenue Distribution:
1. Split revenue by product price (Low-priced and High-priced).
2. Revenue by age group and gender of customers.
3. Revenue by how customers pay (cash, credit, debit, mobile).
Profitability Analysis:
1. Show our most profitable brand, location, customer, salesperson age group.
2. Show overall profit margin (how much profit we make as a percentage).
Customer Insights:
1. List the top 10 customers based on how much they spend.
2. Show the total number of customers we have.
Geographic Revenue Distribution:
Show revenue from different locations (cities/regions).
Sales Performance:
Show key numbers like quantity sold, total revenue, cost of goods sold (COGS), and total profit.
Revenue Analysis:
1. Show total revenue numbers for different categories (like products, locations, and customer groups).
2. Show what percentage each category contributes to the total revenue.
Change Analysis:
1. Show how revenue changes from one quarter to the next (quarter-over-quarter).
2. Show monthly revenue changes (month-over-month) and explain why some months did better or worse.
3. Show weekly revenue changes (week-over-week), especially comparing how weekdays and weekends perform.
Key Performance Indicators (KPIs):
Quantity Sold, Total COGS, Total Revenue, Total Profit, and Profit Margin. The most profitable brand, location, customer, and age group.
Interactive Features:
Allow users to switch between seeing revenue as total values or percentages. Include filters for locations and payment methods (cash, credit, debit, mobile) and age group so users can see custom views.** Here are my key takeaways:**
1. Helps make quick, informed decisions by showing the key business insights in one place.
2. Finding the most profitable customer groups and locations to improve marketing and sales strategies.
3. Tracking how well sales are doing and how many new customers gained.
4. Give full details of how revenue is performing in both numbers and percentages.
5. Helps finding trends in revenue changes for quick respond.
6. Regularly track key numbers to monitor business health and find areas to improve.
Medical Service Provider Analysis: Optimizing Healthcare Through Data-Driven Insights
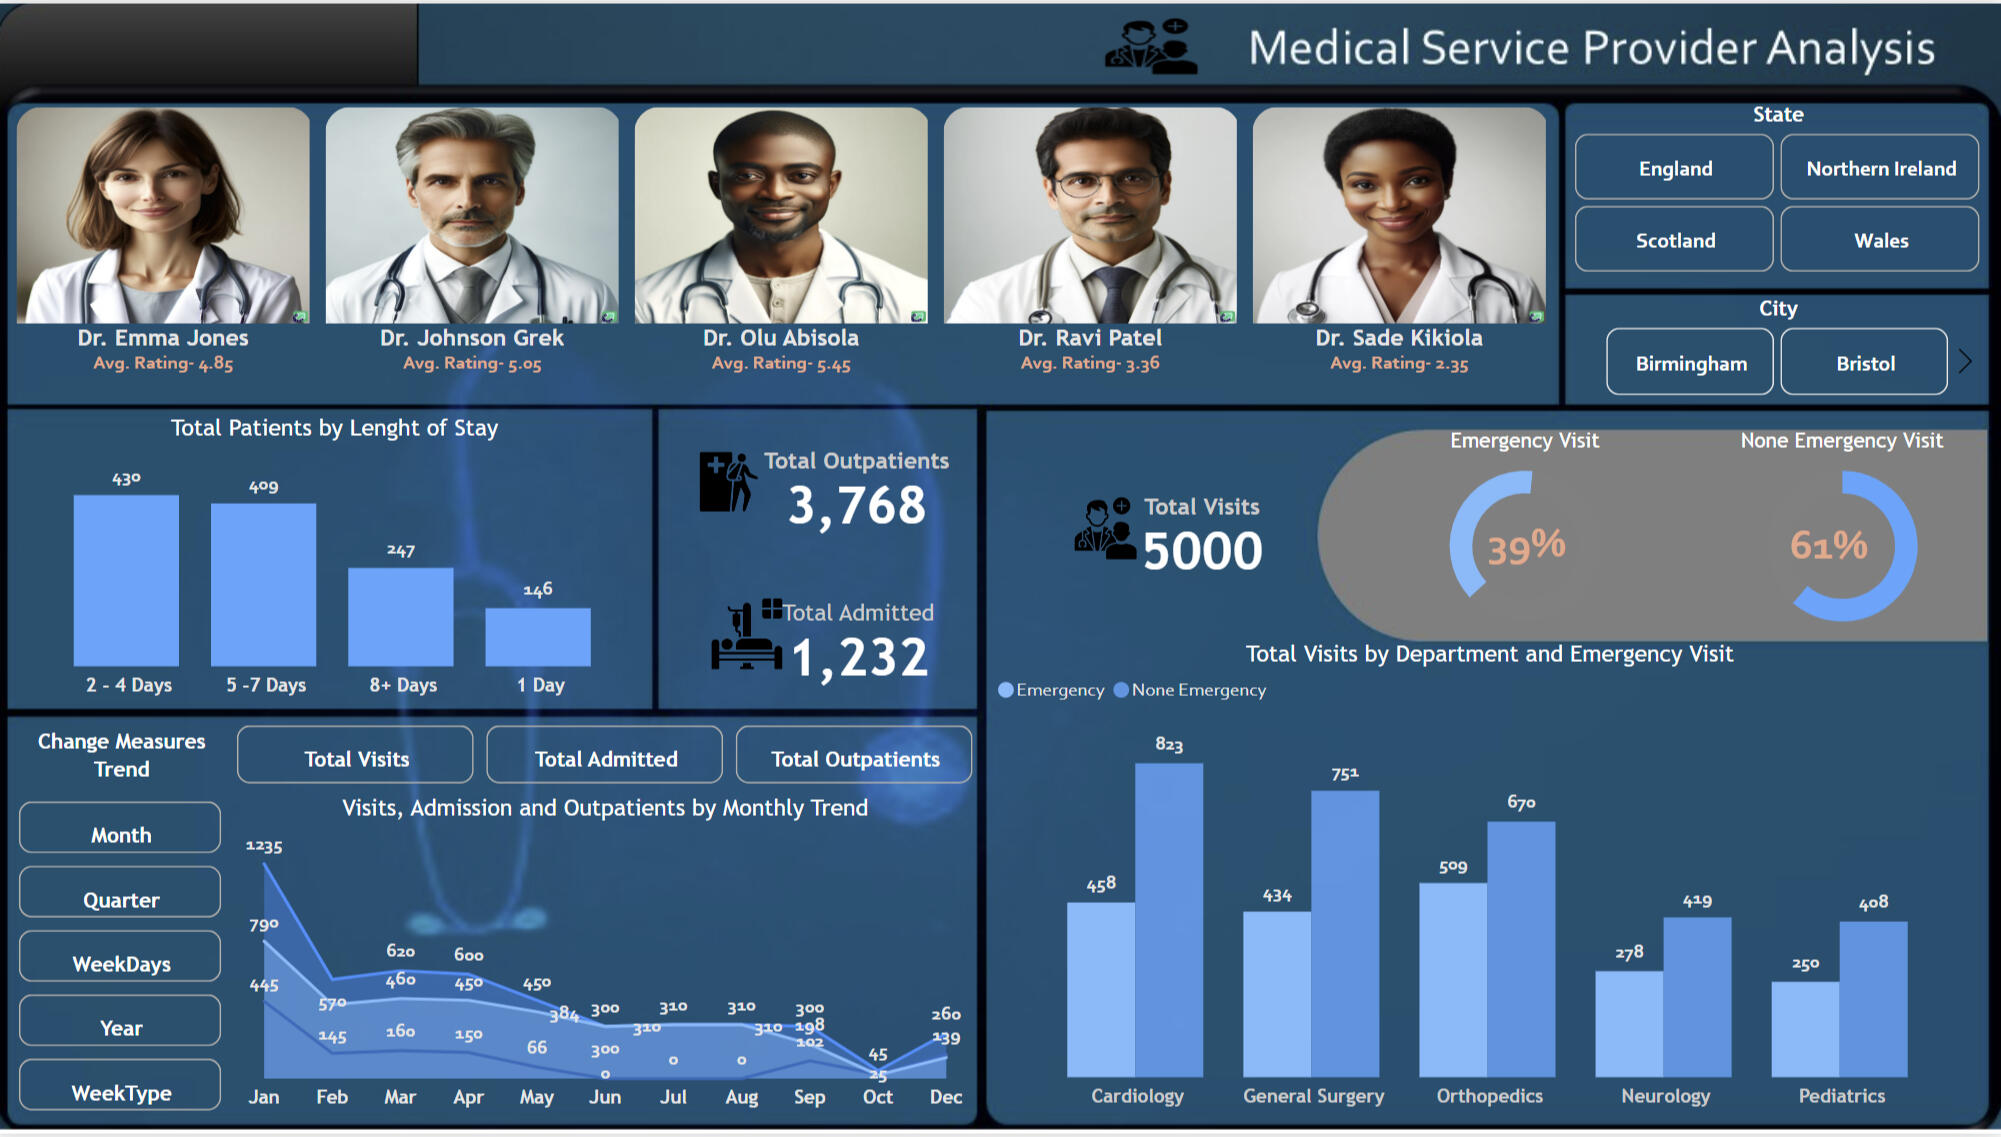
Unlocking Insights into Medical Service Providers: A 3-Page Power BI Marvel 🏥💉💼Ever wondered how healthcare providers assess billing trends, track patient visits, and optimize their medical services? Look no further! I've just crafted an insightful Power BI dashboard that unveils the key metrics behind medical service provider operations.Dive into the World of Medical Billing, Departmental Performance, and Provider Assessments
Explore the intricate dynamics of Billing Amounts, Medication Costs, Treatment Expenses, and more! This interactive masterpiece empowers you to explore departmental performance, geographic billing trends, and provider assessments with just a few clicks.Page 1: Fiscal Analysis
💰 Discover how the total billing amount, medication costs, and treatment expenses are distributed across departments like Cardiology, General Surgery, and Pediatrics. Uncover regional trends with an in-depth look at billing contributions from cities like Glasgow and Edinburgh. Target cost management and departmental optimization strategies to drive financial efficiency and revenue growth.Page 2: Trend Evaluation
📈 Analyze year-over-year and quarter-over-quarter billing trends to identify peak periods and potential revenue dips. Track how billing fluctuates across months and weekdays, particularly focusing on departments like Orthopedics and Neurology. Use this data to align staff and resources with peak demand periods, ensuring optimal service delivery.Page 3: Provider Assessment
👩⚕️👨⚕️ Assess physician performance, patient stay durations, and visit trends to enhance service quality. From the highest-rated physicians to the balance between emergency and non-emergency visits, this page offers a comprehensive overview. Implement targeted training for lower-rated physicians and expand services in high-demand areas like Cardiology to boost patient satisfaction and retention.Unlock the secrets behind medical service provider operations with this powerful and interactive Power BI dashboard. It's more than just data, it's the key to optimizing healthcare delivery and driving patient outcomes to new heights.
Electric Vehicle Market Analysis
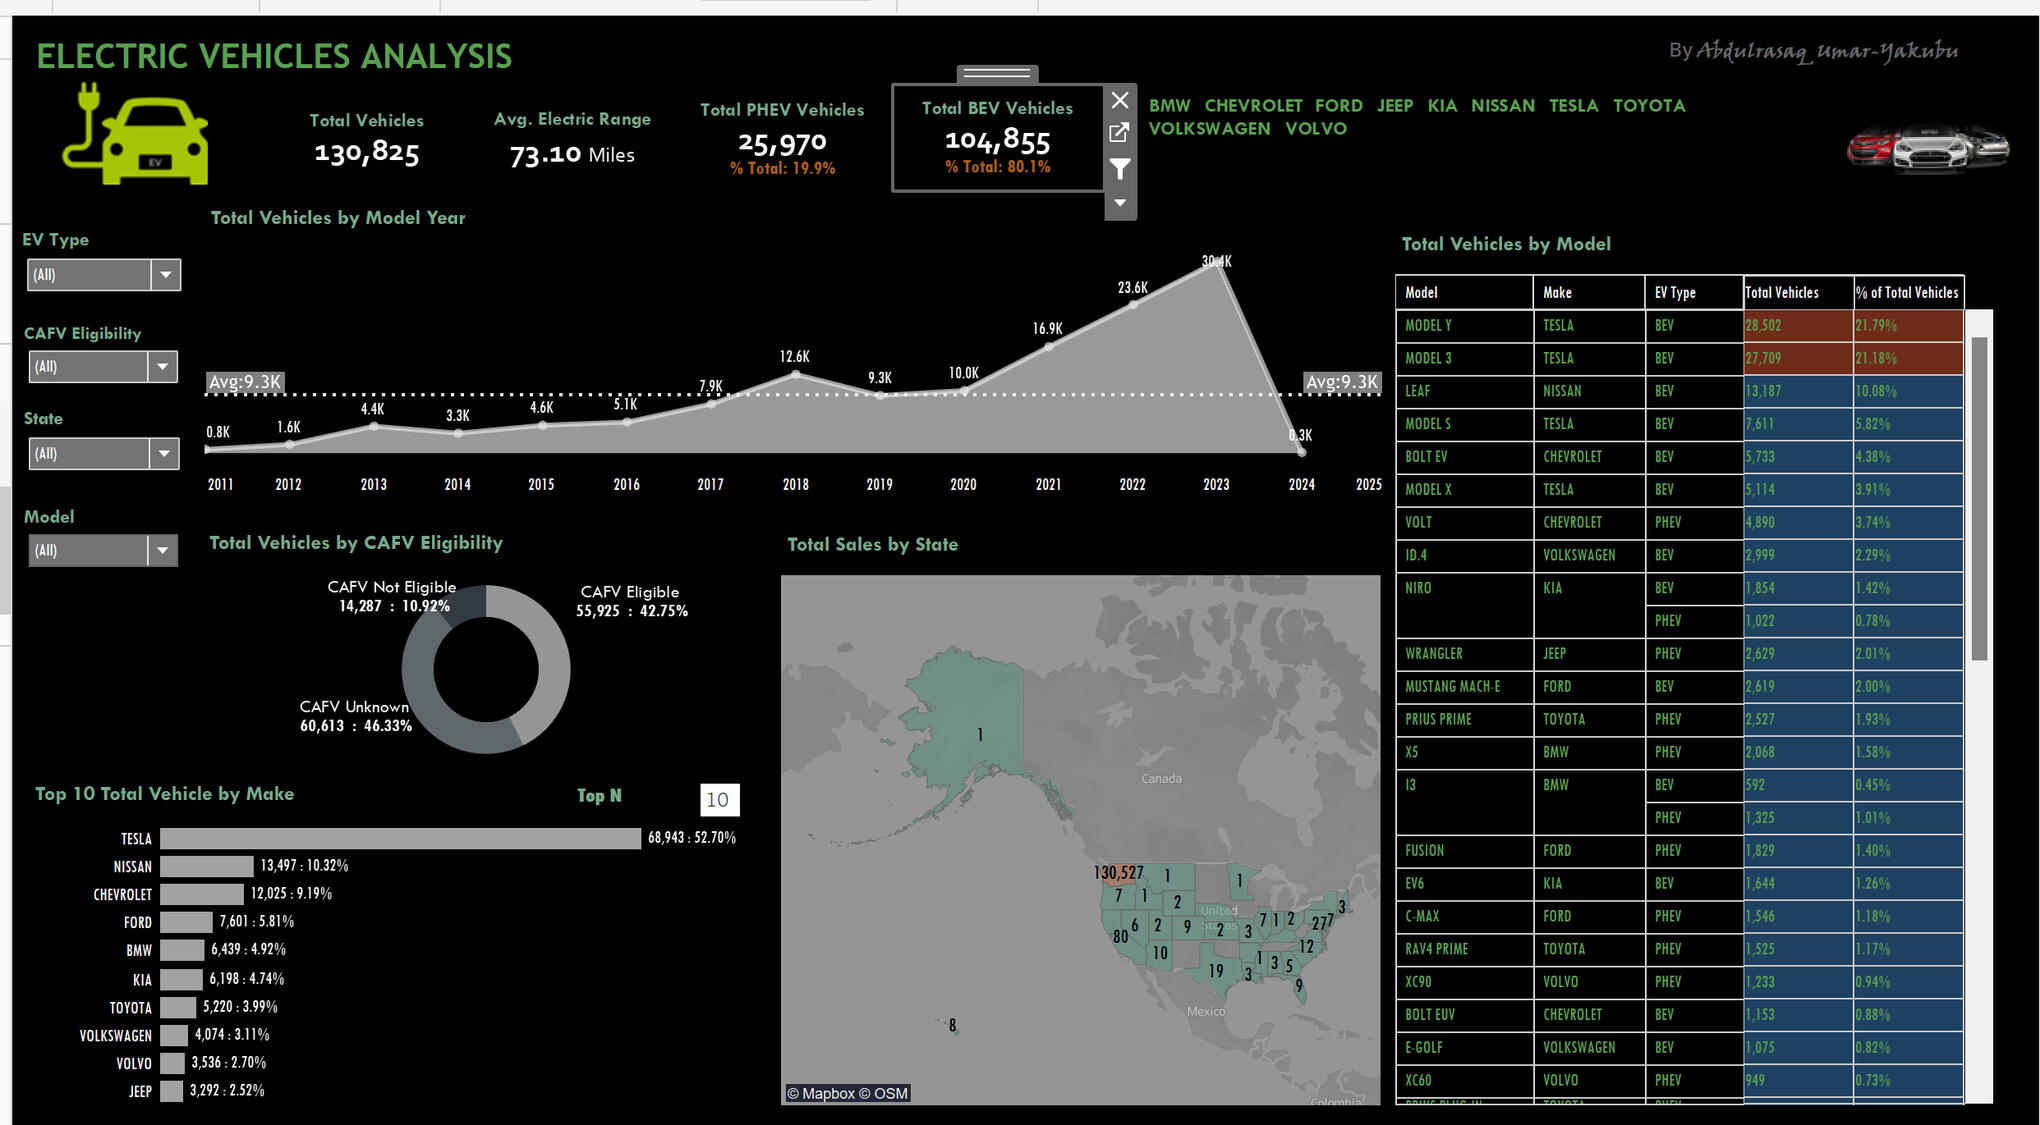
This dashboard offers a thorough analysis of the electric vehicle (EV) landscape, highlighting several key metrics for a deeper understanding of the market. It tracks the total number of EVs in circulation, providing insight into the market's growth.The dashboard also includes the average electric range, allowing for comparisons across different vehicle models. Additionally, it breaks down the distribution of vehicle types, showing the popularity of various EV categories like sedans, SUVs, and trucks. It also covers trends in charging infrastructure, showcasing the development of public and private charging stations.The dashboard provides a clear picture of regional adoption rates, helping to identify high-growth markets. Vehicle performance data is analyzed to understand efficiency improvements over time. Market share by manufacturers is displayed, offering insights into competitive positioning. Furthermore, consumer preferences, such as range anxiety and cost considerations, are also examined.Ultimately, this dashboard delivers a holistic view of the EV industry’s current state and emerging trends.
Sales Analysis and Self-Service BI Implementation
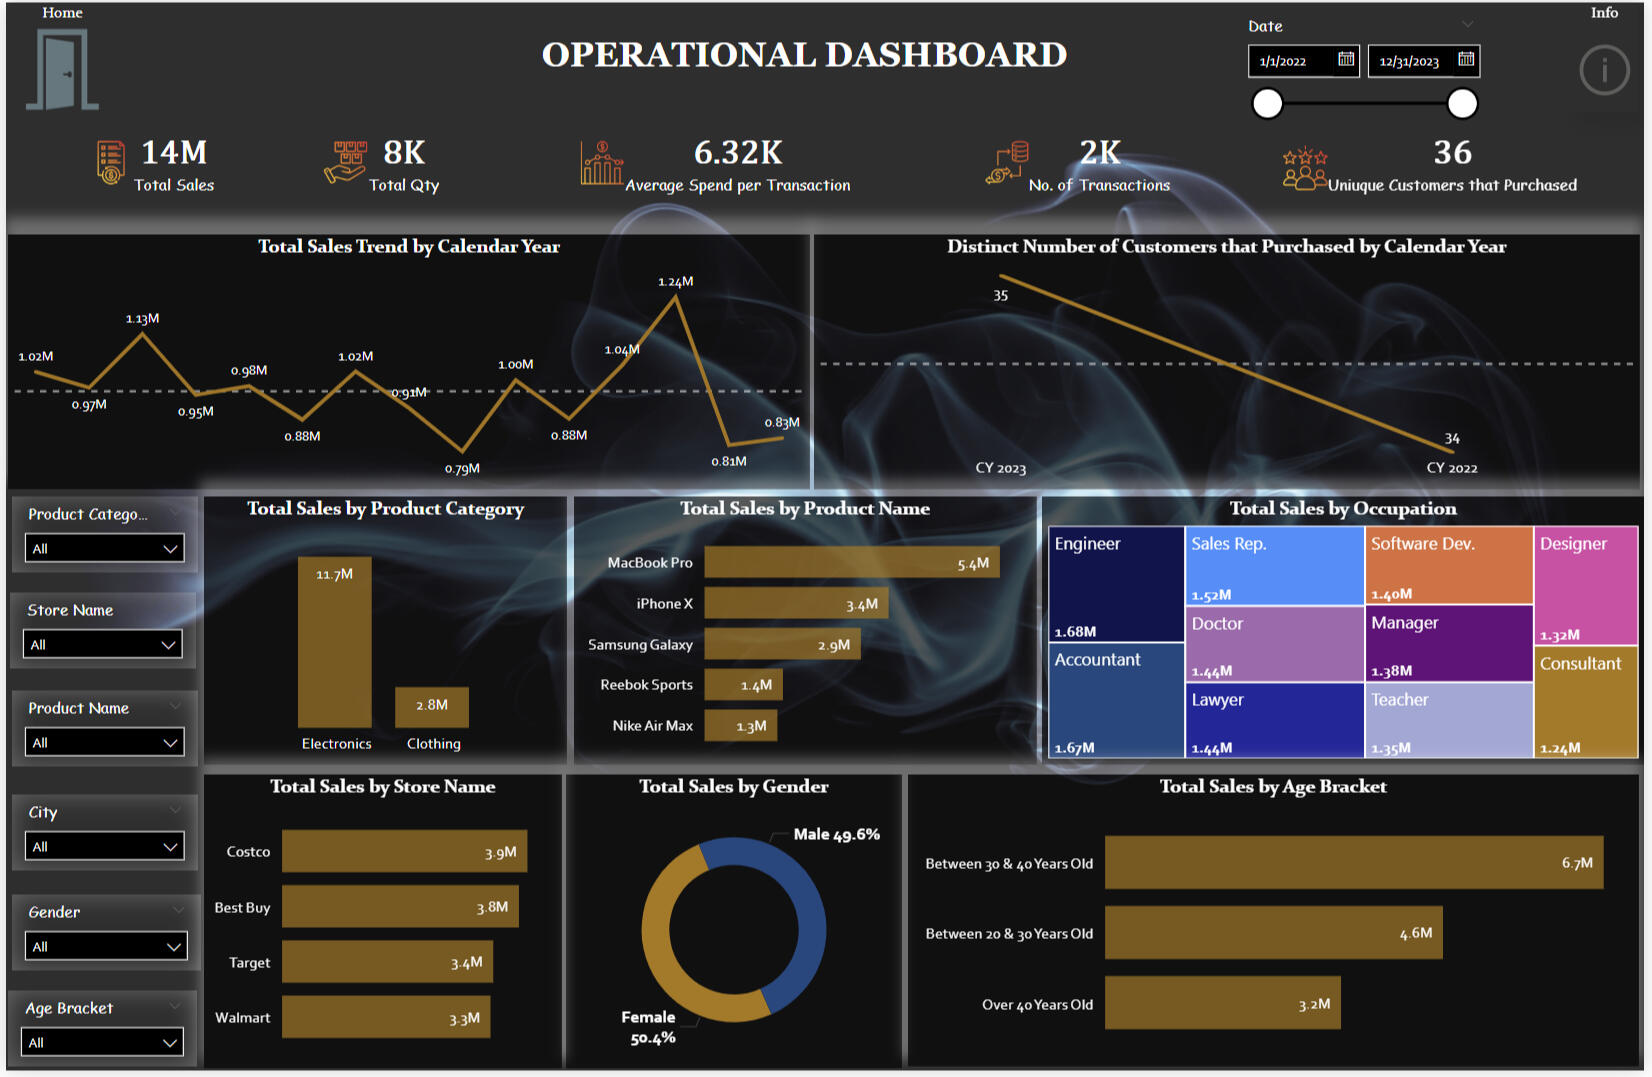
The Sales Analysis Dynamic Dashboard provides a comprehensive overview of key performance indicators (KPIs) related to sales performance across various dimensions. It offers valuable insights into sales trends, product performance, customer behavior, and store operations.Key Metrics
Some of the key metrics include:
Total Sales
Total Quantity Sold
Average Spend per Transaction
Distinct Number of Customers
Sales by Product Category, Product Name, Store Name, Occupation, Gender, and Age Bracket
Sales Trends by Calendar Year and Month.Key Insights
By analyzing the dashboard, users can gain valuable insights into:
Sales Trends: Identify growth or decline patterns in sales over time.
Product Performance: Evaluate the popularity and sales performance of different products and categories.
Customer Behavior: Understand customer demographics, purchasing habits, and spending patterns.
Store Performance: Compare the sales performance of different stores and identify areas for improvement.
Geographic Analysis: Analyze the impact of store location on sales.
Conclusion
This Sales Analysis Dynamic Dashboard is a powerful tool for making data-driven decisions, optimizing sales strategies, and improving overall business performance. By leveraging on the insights provided by this dashboard, businesses can identify growth opportunities, address challenges, and enhance customer satisfaction.
Ozone Concept Ltd Inventory Optimization Analysis
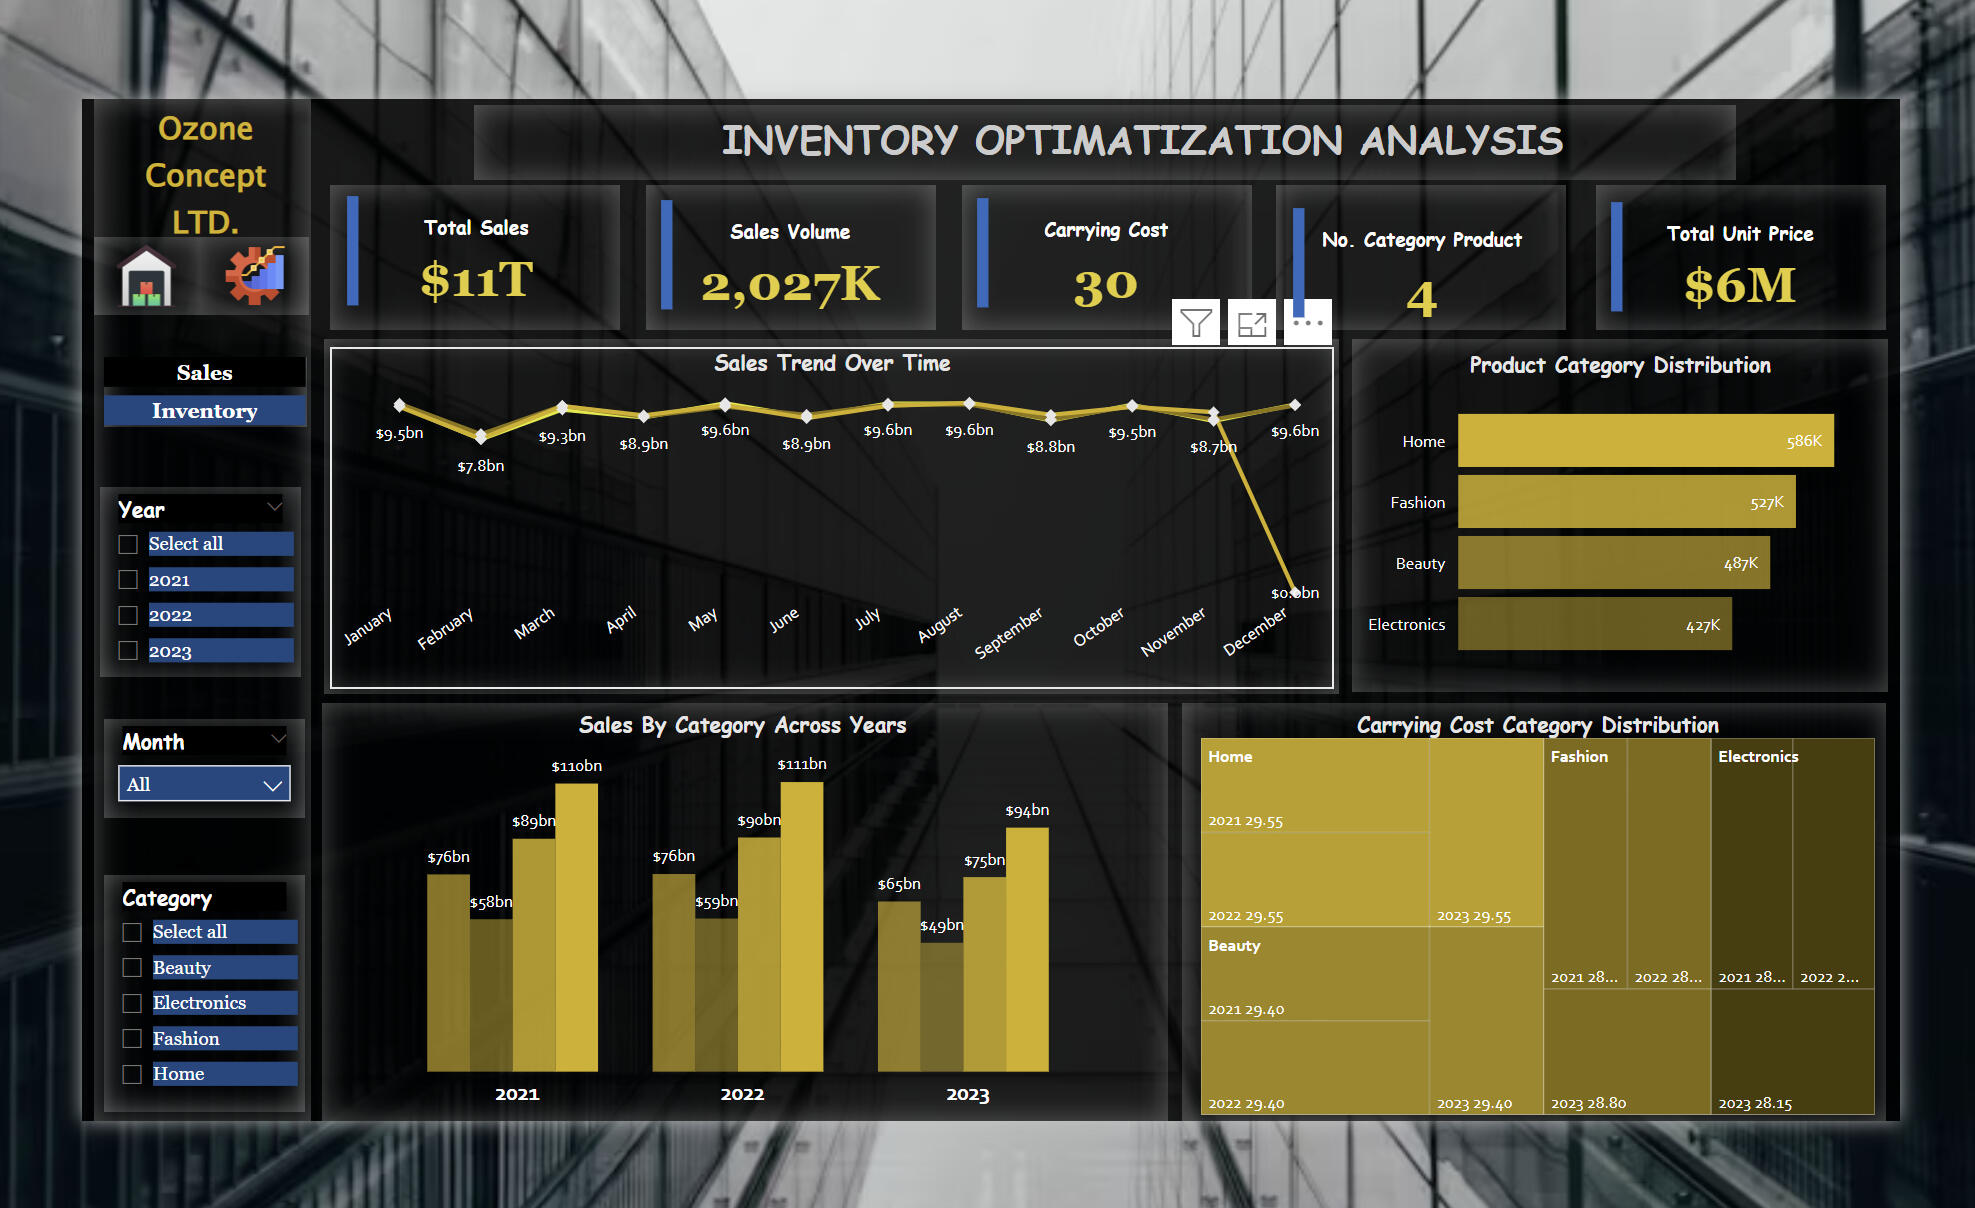
The Ozone Concept LTD Inventory Optimization Analysis dashboard provides a comprehensive overview of key performance indicators (KPIs) related to inventory management. It offers insights into inventory levels, stockouts, turnover rates, and product distribution. Its one of my internship project at 10Alytics Data & Strategy.Key Metrics:
Stockout Incidents: Indicates the number of instances where inventory was insufficient to meet demand.
Inventory Turnover: Measures the efficiency of inventory management by calculating the number of times inventory is sold and replaced during a period.
Average Inventory: Shows the average inventory level maintained.
Current Inventory: Displays the current inventory value.
Inventory Begin vs End: Compares the inventory levels at the beginning and end of a period.Visualizations:
Bar Charts: Represent the inventory turnover, average inventory, and current inventory levels.
Line Chart: Illustrates the inventory trend over time.
Pie Chart: Shows the distribution of inventory across different product categories.
Radar Chart: Compares the inventory turnover for each product category.
Line Graph: Tracks stockout incidents over time.Key Insights:
Inventory Management Efficiency: Evaluate the inventory turnover rate to identify areas for improvement.
Stockout Analysis: Analyze stockout incidents to identify products with insufficient stock levels.
Inventory Optimization: Optimize inventory levels to minimize carrying costs and avoid stockouts.
Product Performance: Assess the inventory distribution across different product categories to identify best-sellers and slow-moving items.Conclusion
These Inventory Optimization Analysis dashboard is a powerful tool for making data-driven decisions regarding inventory management, optimizing costs, and ensuring efficient supply chain operations. By leveraging on the insights provided by this dashboard, businesses can improve inventory forecasting, reduce stockouts, and enhance overall profitability.
Coca-Cola Sales Analysis Dashboard with Excel Macros
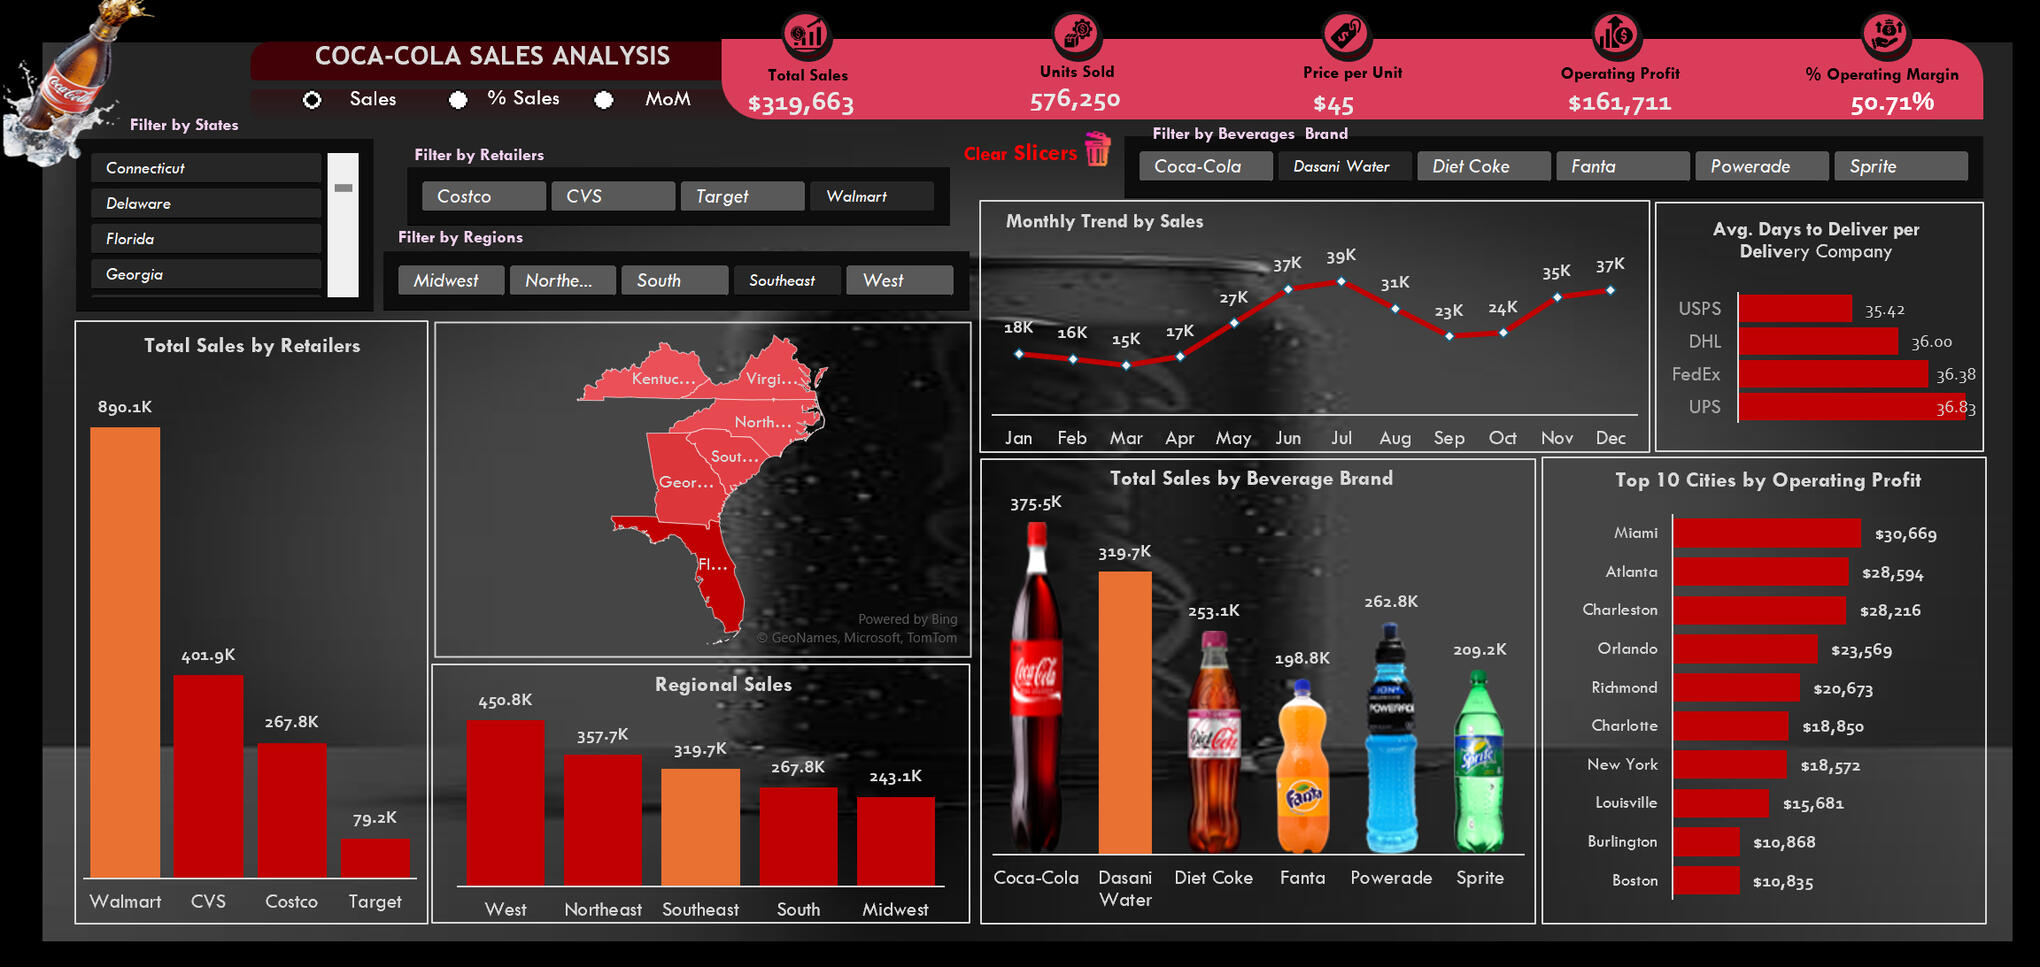
This project focused on developing a fully automated Coca-Cola Sales Analysis Dashboard using Excel Macros, designed to provide deep insights into sales, operations, and logistics. The goal was to streamline data processing, improve visualization, and deliver key performance metrics to inform decision-making.Project Overview:
I began by collecting and cleaning Coca-Cola’s sales data, which included retailer performance, regional sales, monthly trends, and delivery efficiency. By implementing Excel Macros, I automated repetitive tasks like data filtering, calculations, and updating visuals, making the dashboard easily scalable for future data updates.Key Features & Insights:
Total Sales & Units Sold: The company achieved $8.2M in total sales, with over 16.4M units sold. Macros helped automate this data extraction and update it as new sales data was introduced.Retailer & Regional Performance: Walmart emerged as the leading retailer, contributing 4.4M units sold, while the West region topped the chart with 2.4M in sales. The use of macros simplified data analysis by allowing quick toggling between retailers and regions.Monthly Sales Trends: I identified a clear seasonality pattern, with sales peaking in July at 970K units. The trend chart was dynamically generated and updated automatically, allowing Coca-Cola to track performance trends in real time.Product Line Breakdown: The dashboard highlighted that Coca-Cola’s flagship product led sales at 1.9M units, followed by Dasani Water and Diet Coke. Excel Macros allowed automated product comparisons.Delivery & Logistics: By automating data processing, I highlighted that FedEx had the shortest average delivery time, helping Coca-Cola optimize its logistics strategy for faster delivery times.Profitability Insights: New York was the most profitable city, generating $135,984 in operating profit. The dashboard enabled Coca-Cola to quickly identify top-performing cities, allowing for targeted marketing and resource allocation.Outcome:
The Excel Macro-based dashboard provided Coca-Cola with a robust tool for ongoing analysis, allowing them to:Optimize regional marketing and sales strategies.
Enhance product inventory decisions based on brand performance.
Improve delivery and logistics efficiency.
Easily update and track key metrics with minimal manual intervention.
This project demonstrates my ability to use Excel Macros for data automation and create meaningful visualizations that drive strategic business insights. It highlights my skills in data analysis, automation, and advanced Excel functionalities to support data-driven decision-making in large organizations.
Skyline Construction Budget Analysis Visualization Using Gantts Chart
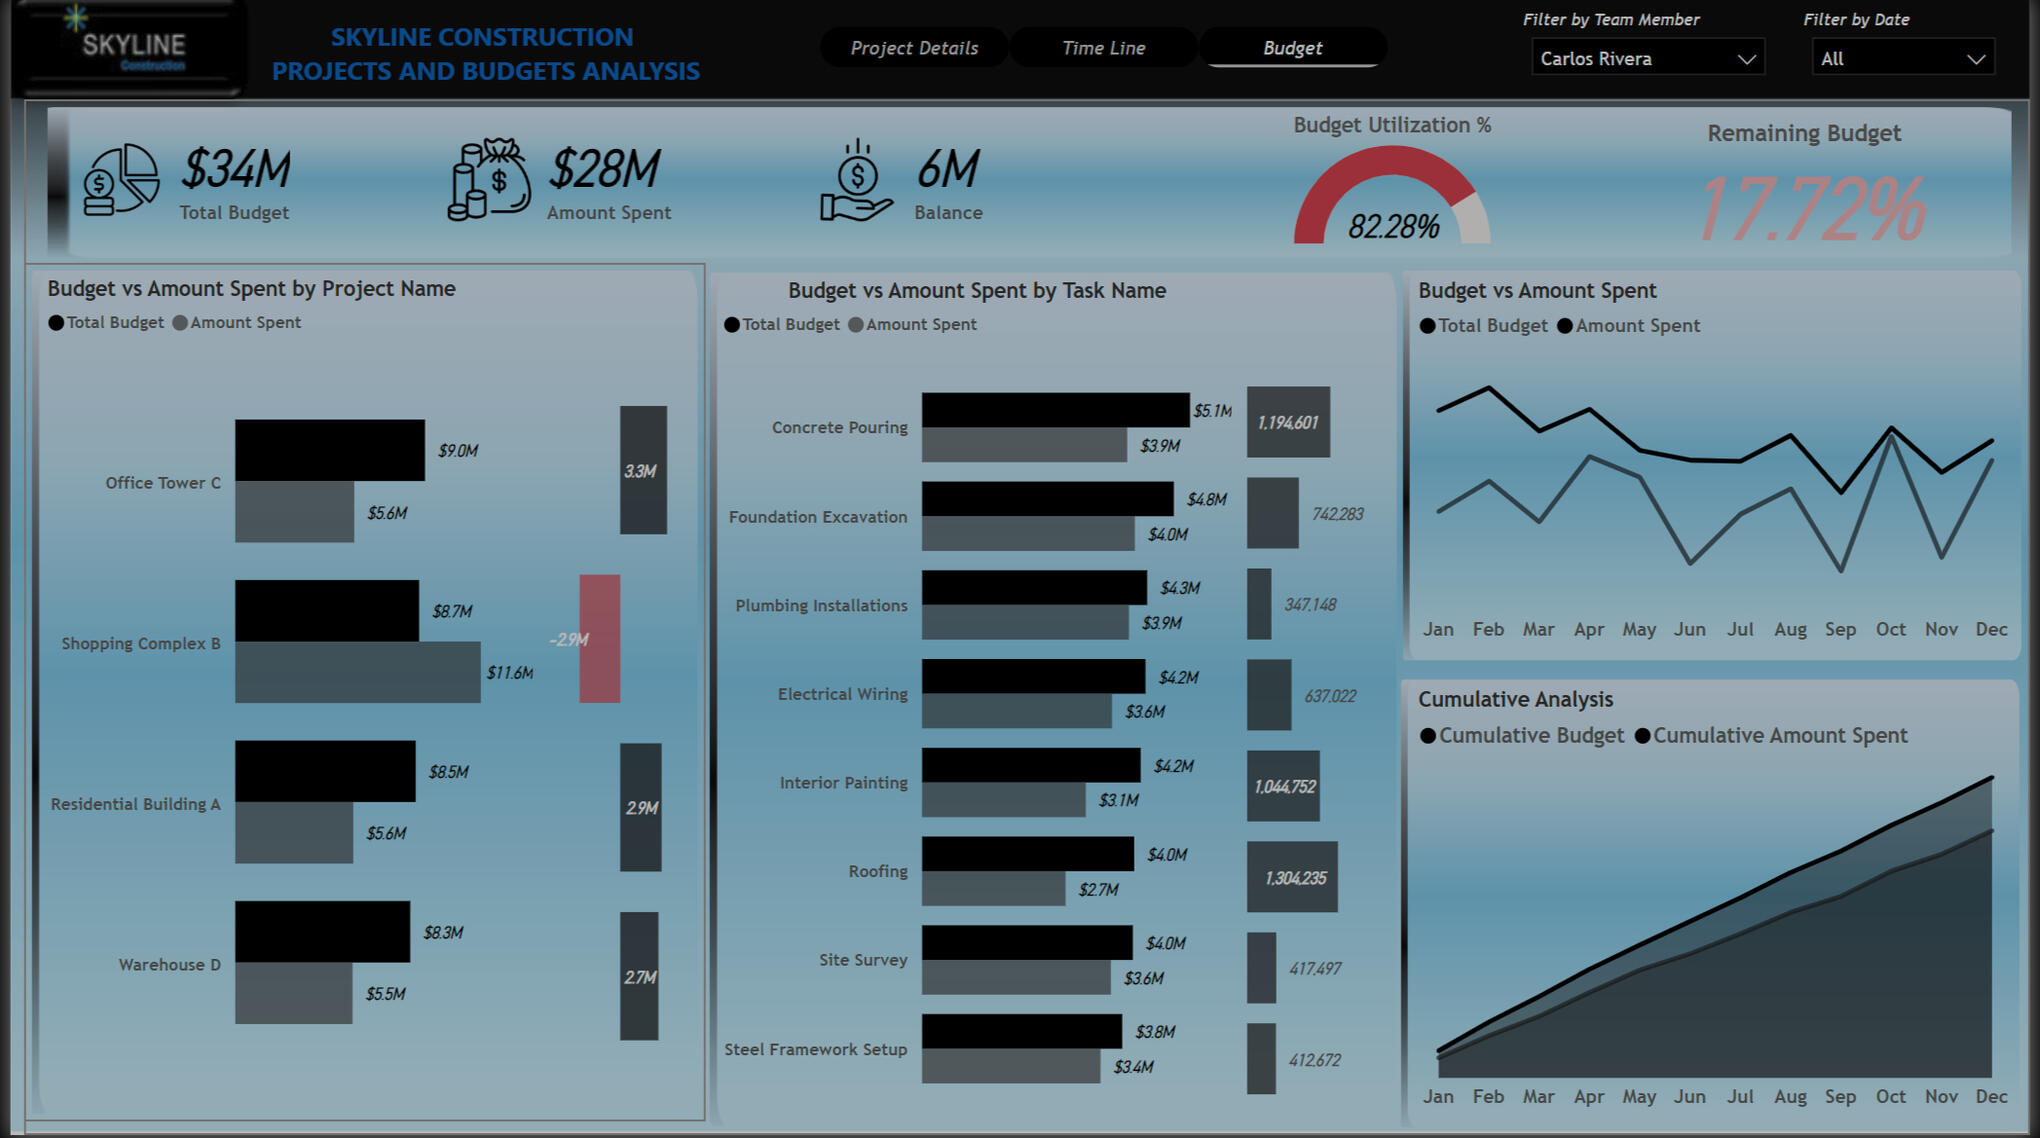
This Power BI visualization provides an insightful analysis of Skyline Construction's projects and budgets. It showcases a comprehensive overview of total budgets, expenditures, and progress tracking for various projects. The dashboard is interactive and aimed at empowering stakeholders to monitor budget utilization, identify discrepancies, and evaluate project performance effectively.The dashboard primarily addresses:Budget Allocation and Spending: Projects and task-level comparisons of total budgets versus actual expenditures.
Budget Utilization: Analysis of utilization rates, remaining balances, and key performance indicators.
Project Timelines: Tracking task progress across specific time periods.
Cumulative Performance Analysis: A cumulative view of budget and expenditure trends throughout the year.
1. Key Metrics Overview
Total Budget: $34M
Amount Spent: $28M
Balance: $6M
Budget Utilization Rate: 82.28%
Remaining Budget: 17.72%
The top panel effectively summarizes the high-level financial performance of the organization, providing clarity on the overall budget health.2. Budget vs Amount Spent by Project Name:
Office Tower C:
Budget: $9M
Spent: $5.6M
Remaining: $3.4M
Shopping Complex B:
Budget: $8.7M
Spent: $11.6M (Over Budget by $2.9M)
Residential Building A:
Budget: $8.5M
Spent: $5.6M
Remaining: $2.9M
Warehouse D:
Budget: $8.3M
Spent: $5.5M
Remaining: $2.7MObservation:
Shopping Complex B is significantly over budget by $2.9M. This requires immediate attention to identify causes and adjust resource allocation.
Other projects like Office Tower C and Warehouse D are operating within budget, indicating better cost control.3. Budget vs Amount Spent by Task Name:
Concrete Pouring:
Budget: $5.1M, Spent: $3.9M → Savings: $1.2M
Foundation Excavation:
Budget: $4.8M, Spent: $4M
Roofing:
Budget: $4M, Spent: $2.7M → Savings: $1.3M
Electrical Wiring:
Budget: $4.2M, Spent: $3.6M
Site Survey:
Budget: $4M, Spent: $3.6M
Observation:Tasks like Roofing and Concrete Pouring have notable under-expenditures, providing opportunities to reallocate savings to over-budget areas.
Monitoring high-spending tasks like Foundation Excavation and Electrical Wiring can help mitigate future overruns.4. Budget Trends and Cumulative Analysis:
Budget vs Amount Spent Trend (Line Chart):
Spending fluctuates throughout the year, peaking in April and October.
Cumulative Analysis (Area Chart):
Cumulative Budget vs Cumulative Spent remains consistent, with a noticeable gap indicating underutilization in certain months.
Observation: The cumulative view highlights a steady pace of spending, though some months display a lag in expenditures compared to budget allocations.5. Project Progress Bar:
Tasks for Warehouse D are broken into various statuses:
Blocked: Red
Completed: Green
In Progress: Orange
Not Started: Blue
Tasks like Roofing and Concrete Pouring appear multiple times, indicating phased execution over the timeline.Observation:
The timeline effectively tracks the progress of each task, providing clarity on ongoing, delayed, or completed activities. Monitoring blocked tasks will help address bottlenecks in execution.Conclusion
This projects is a robust tool for analyzing construction budgets and project performance. It provides:Financial Insights: Clear comparisons of budgets vs actual spending at both project and task levels.Utilization Trends: Identifies over- and under-utilized budgets.Progress Tracking: Monitors project status over time to ensure accountability.
Wallet Watch: Income & Spending Tracker Dashboard
About This Project
I designed and developed this Excel-based Income & Spending Tracker Dashboard to help individuals manage their finances more effectively. The goal was to convert routine financial records into a smart, interactive dashboard that reveals spending habits, income trends, and actionable savings opportunities all in one place.What This Dashboard Covers
Total Income vs. Spending: Shows a real-time comparison of total earnings ($65.44K) and expenses ($30.19K).Top 5 Spending Categories: Rent, Groceries, Clothing, Entertainment, and Cash Loans.Available Card Balance: Displays live balance on a connected Mastercard ($35.25K).Income Sources: Income split between consulting (Data with Decision), YouTube, and Teachable.Monthly Trends: Debit and credit activity over 10 months.Weekly Trends: Highest transactions on Monday; lowest on Wednesday.Key Stats & Features
- Interactive drop-down menu to switch between months
- Doughnut chart for income contribution by source
- Bar charts for monthly and weekly financial behavior
- KPI Cards to highlight:
- Max Spending ($900)
- Max Income ($5,000)Professional fintech-style interface for easy interpretation
Skills Used
- Data Cleaning & Preparation
- Excel Formulas (SUMIFS, -VLOOKUP, IF, etc.)
- Charting & Data Visualization
- Financial Dashboard Design Principles
- Conditional FormattingKey Insights
- Rent is the highest recurring expense at $9,000.
- Data with Decision contributed 76.41% of income.
- Monday saw the most spending activity—ideal for budget reviews.
- Most spending occurs mid-month, suggesting timing adjustments could improve cash flow.
Recommendations
- Set spending alerts for Mondays and mid-month to reduce impulse purchases.
- Diversify income sources to reduce reliance on one primary stream.
- Evaluate and renegotiate high-cost items like rent and groceries.Project Outcome
This project demonstrates how Excel can be used not just for data storage, but for powerful, interactive financial analysis. The dashboard equips users with the tools to take control of their money, track key behaviors, and make smarter decisions.It also showcases my capability to build functional dashboards with a clean design, precise calculations, and strong analytical thinking vital for any data-driven role.